Technological disruption in the app development industry is impacting almost every industry and region today. Regardless of the industry, most companies today need a mobile app to stay in front of prospects and customers and do business with them.
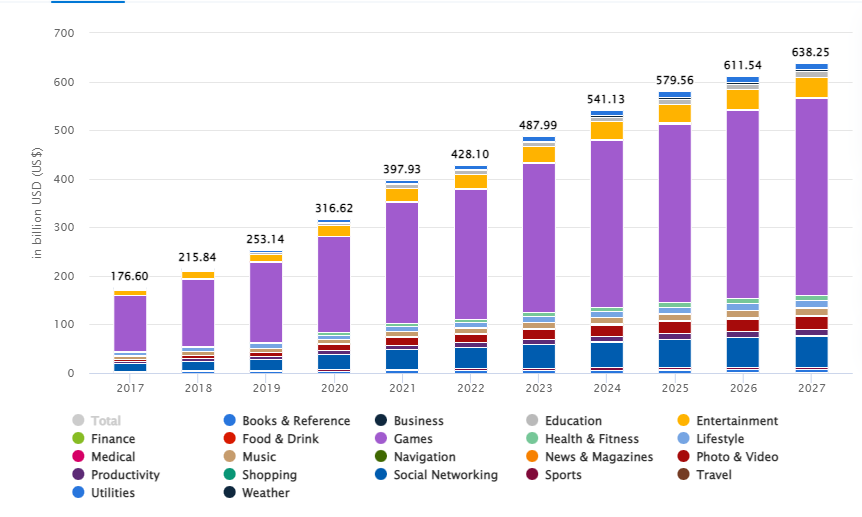
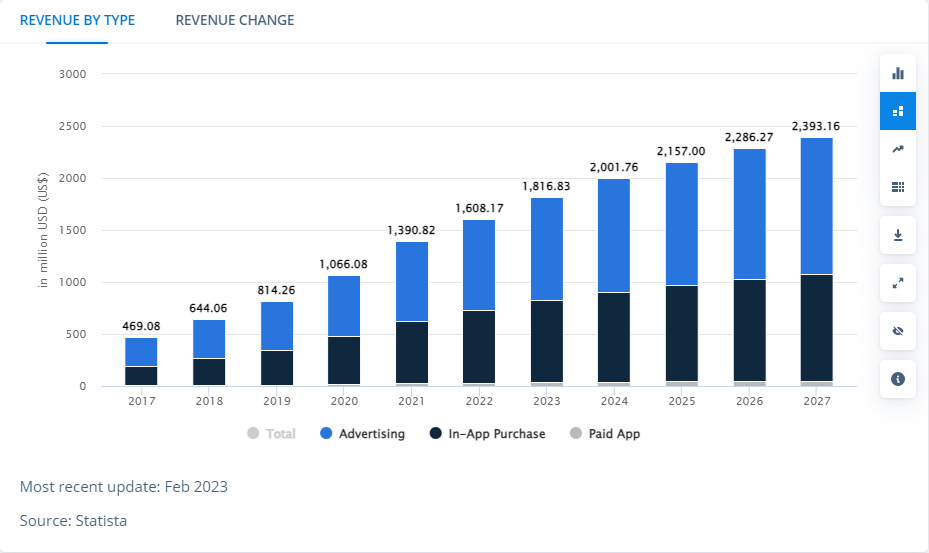
With this in mind, it should come as no surprise that Statista reported that mobile apps generated overall revenue of over $467 billion worldwide by 2023, and this revenue is expected to cross $673 billion by 2027. Following is a graph illustrating this:
(The bar chart above shows worldwide mobile app revenues during the forecast period 2017-2027 [Image Source: Statista])
From the above graph, we find that worldwide mobile app revenues have been increasing each year since 2017, and this trend is expected to continue until 2027 and beyond. With mobile apps predicted to generate an overall revenue of $673.79 billion by 2027, app development companies everywhere are increasing their efforts to get ahead of the competition in order to have a greater share of the overall mobile app revenue.
The companies of top app development companies not only include the companies based in USA or UK but include the top app development companies based in India as well. India recently became the fastest-growing market for apps in the world. These Indian app development companies hold the expertise that meets global standards and that motivates them to go global. In the next section, we look at how the app development industry is growing in India.
How the App Development Industry is Growing in India
In the last few years, there has been a significant increase in the overall revenue generation from mobile apps on both Google Play Store and Apple App Store by Indian app developers. Additionally, the country has the greatest number of downloads across both platforms.
If we were to base the judgment solely on the revenue earned from the apps, then the most popular app category amongst Indian users is social media apps, which feature apps, such as Facebook, and Instagram and this is followed by messaging apps such as Whatsapp. However, the rankings change when the app categories are listed based on the number of downloads.
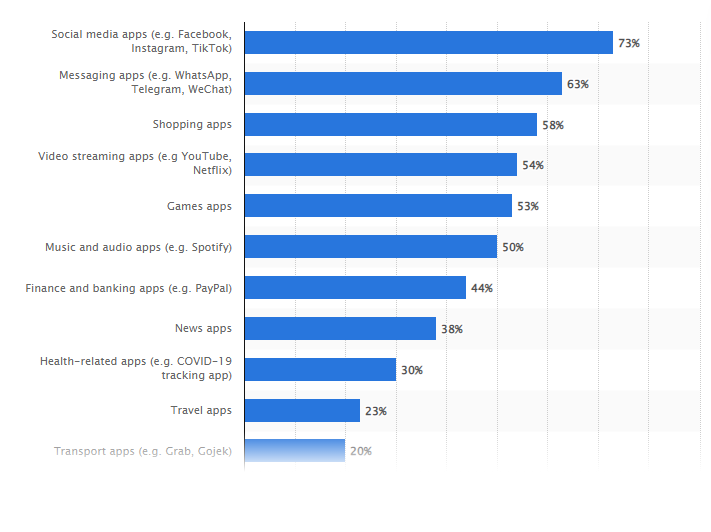
In 2021, the most popular app install category was social media apps, followed by messaging apps. Following is an illustration of this:
(The bar chart above shows the most popular app install categories in India in 2023 [Image Source:Statista])
From the above infographic, we find that the most popular app category in India in 2023 was social media, making up a quarter of all mobile app downloads during the year. In second place were internet browsers, which made up 65% of all app downloads in India in 2023. Shopping apps came in third place, with a 64% share of the overall downloads. E-mail services apps took fourth place with 61% of the overall downloads. Messenger apps - perhaps to the surprise of many - were fifth.
Another surprise was music apps finishing sixth with a 54 % share of the overall app downloads. Less of a surprise was gaming apps finishing seventh. The remaining overall app downloads were shared between different app categories, which included calendars, camera/photo editing apps, health apps, and more.
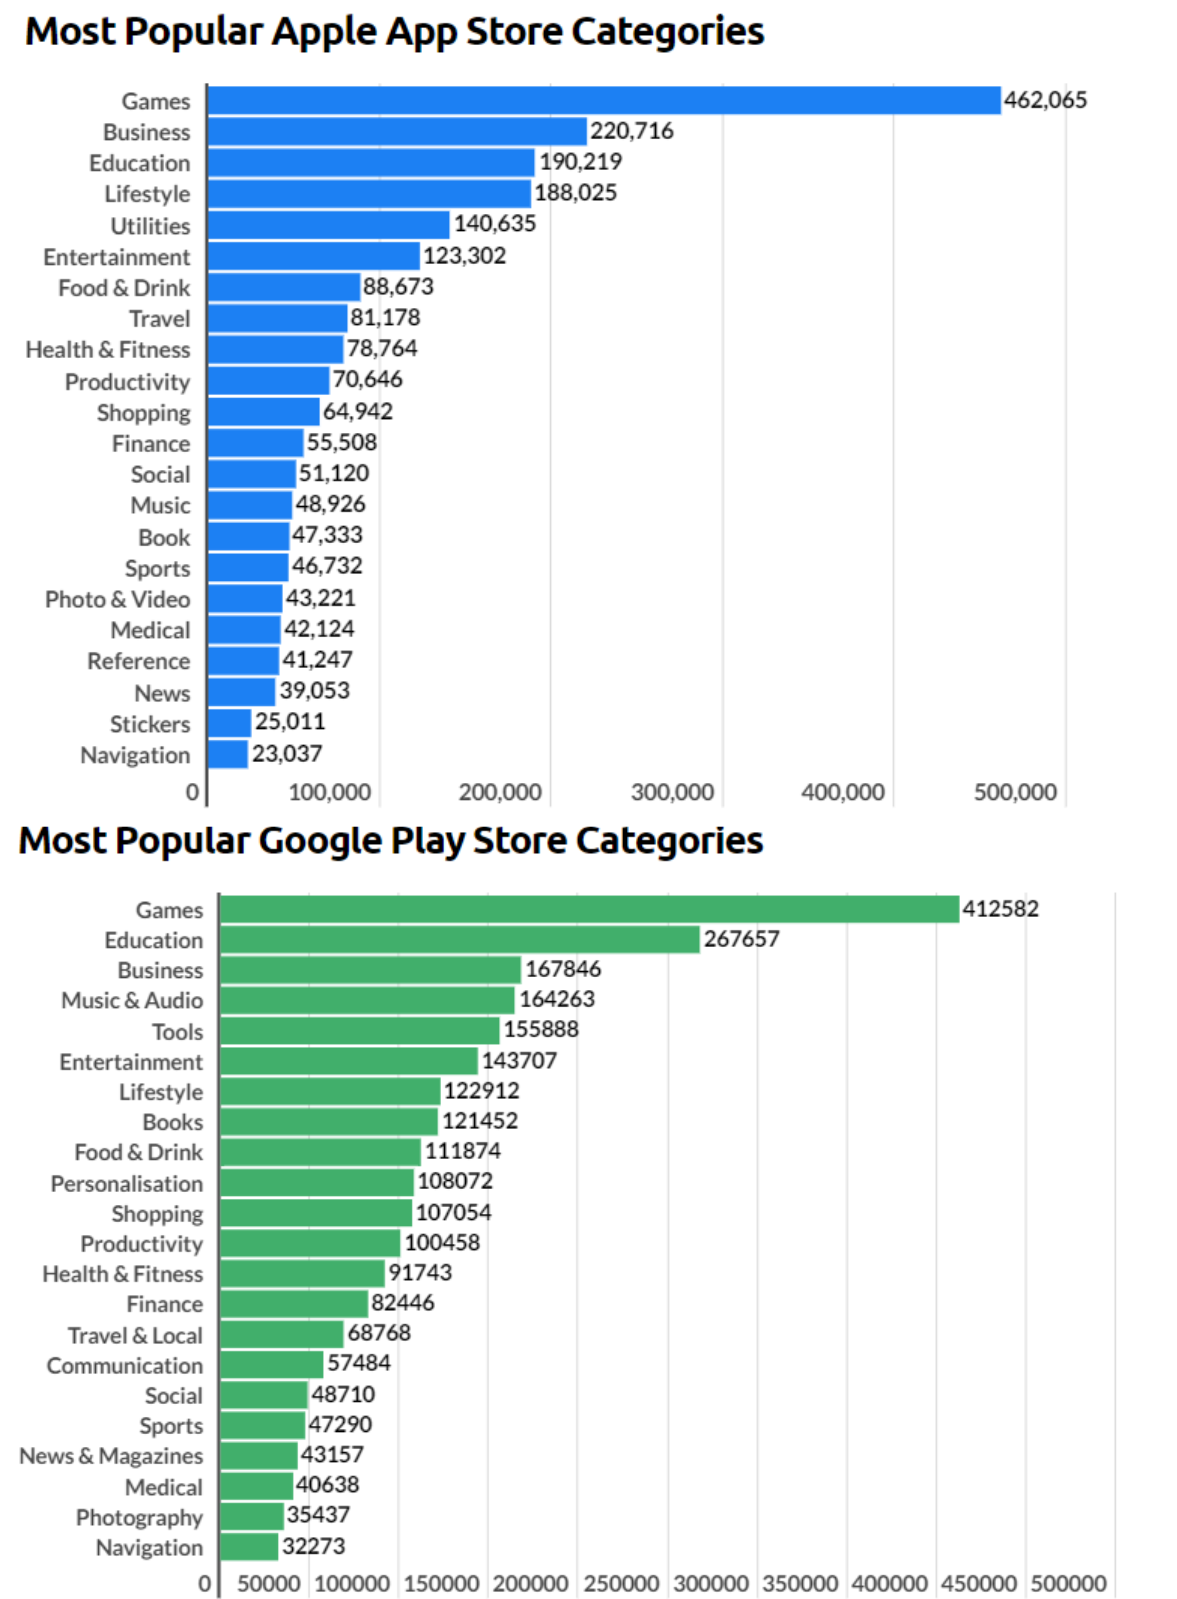
An important thing to know and understand is that the top mobile categories in India differ slightly on the Apple App Store and Google Play Store. For example, while both the Apple App Store and Google Play Store had entertainment as the most popular app category in India, the rankings of many other app categories differed on these platforms. Following is an infographic illustrating this:
(The two graphs above show the most popular app categories on iOS and Android [Image Source: Statista])
From the above charts, we find that the most popular app categories on both iOS and Android are gaming applications with more than 4,81,000 and 4,16,000 overall app downloads. The second most popular app category on iOS is business with more than 2,30,000 app downloads. Whereas On Android, the second most popular app category is educational apps with over 2,68,000 overall app downloads.
Viceoversa The third most popular app category on iOS was educational apps with over 1,90,000 downloads whereas for Android it was business apps with over 1,68,000 downloads. Lifestyle apps were the fourth most popular app category on iOS in 2022.
On Android, the fourth most popular app category was tools apps with more than 1,52,000 overall downloads. Utility mobile applications were the fifth most popular app categories on iOS while entertainment apps ranked sixth with over 1,25,000 downloads.
Food & drink apps came in seventh place, with over 92000 downloads, followed by travel apps with 84000 downloads each. Other apps, like those for health & fitness, productivity, shopping, and finance, reported fewer download counts compared to the others.
Music and Audio apps were the fifth most popular app category on the Google Play Store with over 1,44,000 downloads. Entertainment apps ranked sixth with around 1,34,000 app downloads. And Lifestyle mobile apps were the seventh most popular category with more than 1,21,000 overall downloads. Books apps ranked above food & drink mobile applications with more than 1,12,000 downloads. The other categories like Shopping, productivity, healthcare, fitness, and more reported fewer download counts compared to the others.
In addition to the above statistics, it was found that the average number of hours spent by Indians on their smartphones was four. Additionally, they check their phones over a hundred times in a day. Another interesting finding was that the average number of apps installed on the smartphones of Indians was thirty-two.
In addition to the above statistics, it was found that the average number of hours spent by Indians on their smartphones was four. Additionally, they check their phones over a hundred times a day. Another interesting finding was that the average number of apps installed on the smartphones of Indians was fifty-one while they use only twenty-four of them regularly.
These and other numbers related to app download and usage in India have led to the establishment of many top app development companies in the country. These app developers not only serve local customers but also offer international clientele the opportunity to get their apps built at a highly affordable cost.
The Most Popular Paid App and Free App Categories in India
As the name suggests, paid apps are apps that are downloaded by users for a fee. In other words, users pay money to download the paid app. In addition to charging a fee for download, app developers or owners of paid apps can make money through advertisements and in-app purchases.
On the other hand, free apps are free to download. However, like paid apps, they too can be monetized. Some ways of monetizing free apps are in-app purchases, advertisements, monthly/annual subscription, partnerships, and sponsors, and building email and SMS marketing lists.
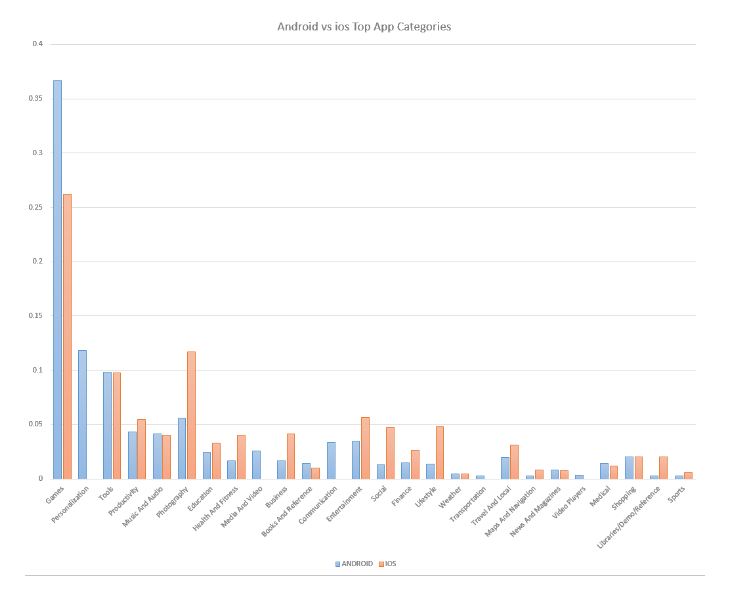
Now, the most popular apps on Android overall are different from the same on iOS. However, you don’t need to approach app monetization differently on each platform. Following is a comparison graph showing the top app categories on iOS and Android in India in 2023.
(The comparison bar charts show the top app categories on iOS and Android in India in 2023 [Image Source: Statista])
From the above graph, we find how the most popular apps on iOS compared with the most popular apps on Android in terms of both categories and numbers. We find that there is a considerable difference in the most popular app categories on iOS and Android and their percentage of the overall downloads on the platform.
However, that is not important here. What is important here is to provide you with the list of both the most popular paid app categories and the most popular free app categories in India on both iOS and Android. We will start with the most popular paid app categories on Android.
The Most Popular Paid App Categories on Android
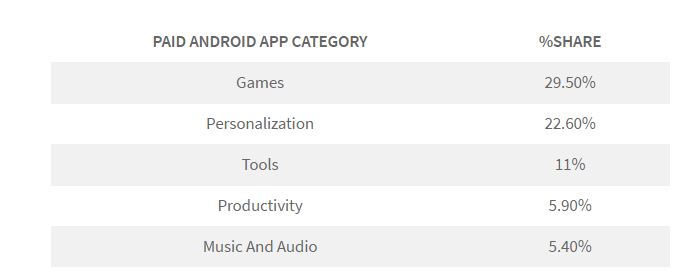
Below are the most popular paid app categories on Android in India in 2023. These categories are listed with their percentage of share.
(The table above shows the top 5 paid app categories on Android in India in 2023 [Image Source: Statista])
From the above table, we find that the most popular paid app category on Android in India in 2023 was games with a 29.50% share. The second most popular paid app category was personalization, with a 22.60% share and tools came in third place with an 11% share.
Productivity and music & video apps completed the list of the top 5 paid apps categories on Android in India in 2023. From this list, you should get at least some idea about what type of paid apps you should be looking to develop to get the attention of your target audience in India and make money for your business.
The Most Popular Paid App Categories on iOS
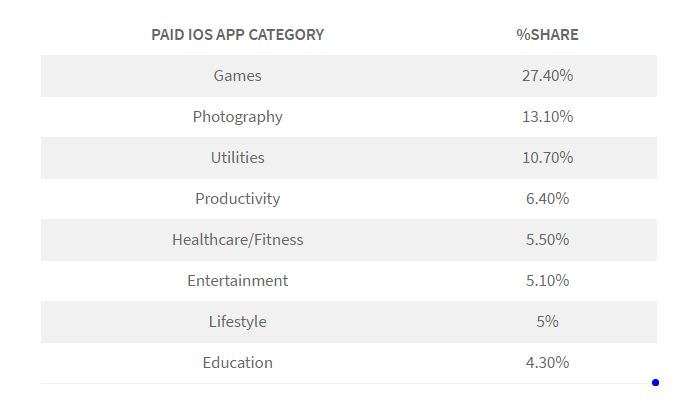
Below are the most popular paid app categories on iOS in India in 2023. These categories are listed with their percentage of share.
(The table above shows the top 8 paid app categories on iOS in India in 2023 [Image Source: Statista])
From the above table, we find that the most popular paid app category on iOS in India in 2023 was games with a 27.40% share. The second most popular paid app category was photography with a 13.10% share, while utility apps came in third place with a 10.70% share.
Productivity apps came in fourth place, with a 6.40% share. Healthcare and fitness came in fifth place with a 5.50% share. Entertainment apps were sixth; lifestyle and education apps rounded off the list of the top 8 paid apps categories on iOS in India in 2023 with 5% and 4.30% share, respectively.
If you’re considering
iPhone app development for an Indian audience, then the above table should give you an idea about which areas you need to focus on to get the desired results from mobile app development.
The Most Popular Free App Categories on Android
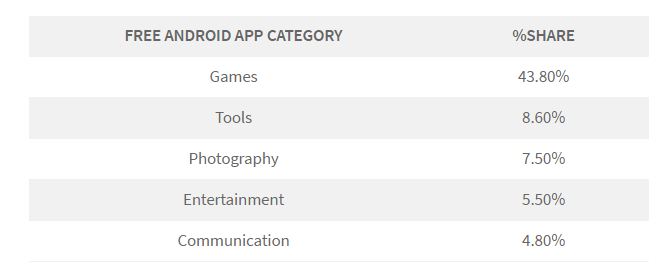
Below are the most popular free app categories on Android in India in 2023. These categories are listed with their percentage of share.
(The table above shows the top 5 free app categories on Android in India in 2023 [Image Source: Statista])
From the above table, we find that the most popular free app category on iOS in India in 2023 was games with a 43.80% share. The second most popular paid app category was tools with an 8.60% share, and photography came in third place with a 8.60% share.
Entertainment and communication apps completed the list of the top 5 free apps categories on Android in India in 2023. From this list, you should get at least some idea about what type of free apps you should be looking to develop if you want to perform
Android app development for an Indian audience.
The Most Popular Free App Categories on iOS
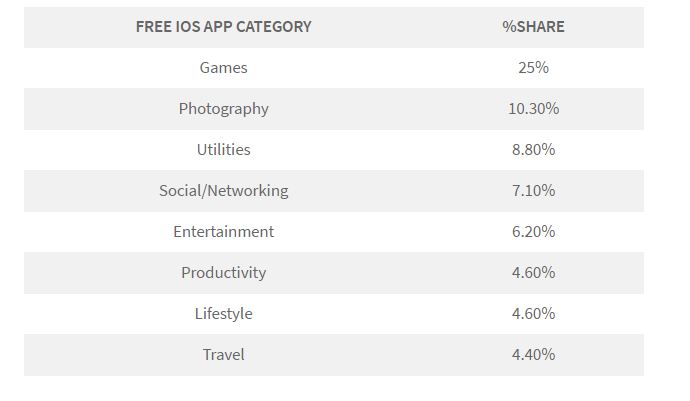
Below were the most popular free app categories on iOS in India in 2023. These categories are listed with their percentage of share.
(The table above shows the top 8 free app categories on iOS in India in 2023 [Image Source: Statista])
From the above table, we find that the most popular free app category on iOS in India in 2023 was games with a 25% share. The second most popular free app category was photography, with a 10.30% share. Utility apps came in third place with an 8.80% share.
Social/networking apps came in fourth place, with a 7.10% share. Entertainment apps came in fifth place, with a 6.20% share. Productivity apps were sixth; lifestyle and travel apps completed the list of the top 8 free apps categories on iOS in India in 2023 with 4.60% and 4.40% share, respectively.
If you’re considering free iPhone app development for an Indian audience, then the above table should give you an idea about which areas you need to focus on to get the desired results from mobile app development.
The Least Preferred App Categories
If you’re looking to hire dedicated developers or a mobile app development company to build a mobile application for an Indian audience, then there are some app categories that you would want to avoid; these are app categories that are least preferred by Indians on both the Android and iOS platforms.
The app categories that you need to avoid when developing a mobile application for an Indian audience are transportation, sports, weather, maps and navigation, and news and magazines.
Mobile App Usage and Revenue in India
According to Statista, the revenue in the app segment in India crossed $3049 million in India. This revenue is expected to grow by 12.0% in 2024 to reach $3510 million. Additionally, app revenue in India is predicted to grow at a CAGR of 7.41% between 2023 and 2027 to reach $4858.00 billion. Following is an illustration of this:
(The graph above shows the app revenue in India during the forecast period 2017-2027 [Image Source])
From the above graph, we find that app revenue in India in 2017 was $ 652 million. This has grown to $3048 million in 2023. Further growth of app revenue is expected in the next four years. App revenue in India is predicted to reach $ 3510 million in 2024, $ 3997 million in 2025, $4455 million in 2026, and $4858 million in 2027.
An important point to note here is that all the revenue from apps during the different years of the forecast period comes from advertising, in-app purchases, and paid applications, thus it includes the contribution from free app users as well.
App Revenue Growth in India
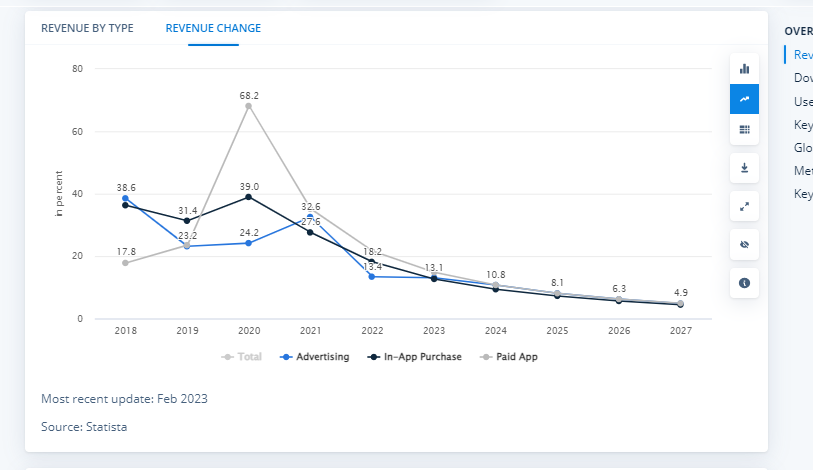
Another interesting finding is that, while app revenue in India is expected to grow in the next four years, the percentage by which it will grow will be less each year. Following is a graph showing this revenue growth:
(The graph above shows app revenue growth in India during the forecast period 2018-2027 [Image Source: Statista])
From the above graph, we find that app revenue in India grew by 43.9% in 2018, and 40.1% in 2019. In 2020, the revenue growth dropped 29.4%. This count crossed 37.3% in 2021; which again dropped 15.8% in 2022, and crossed 12.8% in 2023. This shows the percentage by which app revenue is growing in India has been declining each year since 2022, and this trend is expected to continue until 2027.
There are several reasons for this. However, mobile app developers in India and businesses looking to build a mobile application for an Indian audience should not be too concerned. This is because app usage in India is expected to grow, both in terms of number and percentage, over the next four years. Following is an illustration of this:
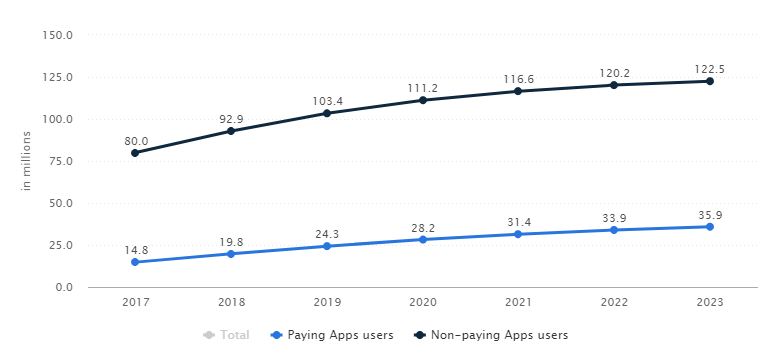
App Users in India
(The graph above shows the number of app users in India during the forecast period 2017-2023 [Image Source: Statista])
From the above graph, we find that the number of app users in India has been growing since 2017. In 2017, the total number of app users in the country was 94.82 million. Of these, 14.81 million were paying app users, while non-paying app users were 80.01 million.
In 2018, the total number of app users in India increased to 112.7 million. Of these, 92.9 million were non-paying users while paying app users made up the rest of the 19.8 million. In 2017, the total number of app users in India increased to 127.7 million. Of these, 103.4 million were non-paying app users while paying app users accounted for the remaining 24.3 million.
In 2020, the total number of app users in India crossed 139.4 million. Of these, non-paying app users were 111.2 million, while paying app users were around 28.2 million.
The total number of app users in India crossed 148 million in 2021. 116.6 million of these users were non-paying app users, while 31.4 million were paying app users. Growth in the number of app users was high in 2022 as well.
The total number of app users in India in 2022 was 154.1 million. Of these, 120.2 million were non-paying app users while paying app users amounted to 33.9 million. Growth is also expected in the final year of the forecast period, which is 2023.
In 2023, the total number of app users in India crossed 158.4 million. Of these, 122.5 million were non-paying app users while paying app users were more than 35.9 million of the total app users in the country in 2023. Growth in the number of app users in India is also expected in the next four years.
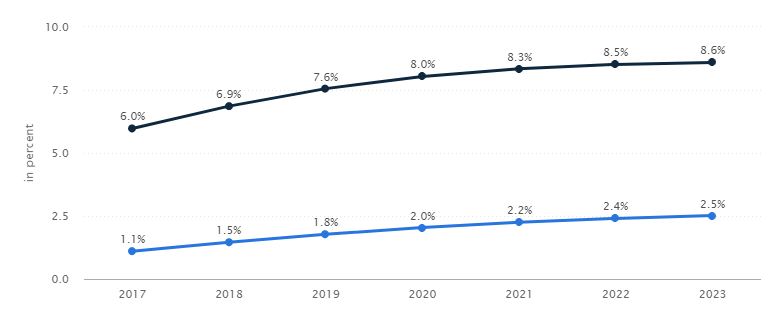
App User Penetration in India
In addition to the above, another important finding of Statista is regarding user penetration in the app segment in India. In 2019, it was recorded at 9.4%, and in 2020, it is predicted to grow to 10.0%. Following is an illustration of this:
(The graph above shows user penetration in the apps segment in India during the forecast period 2017-2023 [Image Source: Statista])
From the above graph, we find that user penetration in the apps segment in India in 2017 was 7.1%. This included a 1.1% penetration rate of paying app users and 6.0% of non-paying app users. In 2018, the penetration rate increased to 8.4%. Of this, 6.9% was the penetration rate for non-paying app users, while the penetration rate for paying app users was recorded at 1.5%.
In 2019, the user penetration rate in the app segment in India in 2019 was 9.4%. This included a 1.8% penetration rate of paying app users and 7.6% of non-paying app users. The user penetration rate in the app segment in India is also predicted to grow in the next four years.
In 2020, the user penetration rate crossed 10.0%. 8.0% of the penetration rate for non-paying users, while the penetration rate for paying users was 2.0%. The user penetration rate grew to 10.5% in 2021. 8.3% was the penetration rate for paying app users, while the penetration rate for paying users was 2.2%.
In 2020, the user penetration rate in the apps segment grew to 10.9%. This included an 8.5% penetration rate for non-paying app users and a 2.4% penetration rate for paying app users. Finally, in the last year of the forecast period, which is 2023, user penetration in the apps segment in India crossed 11.1%. This includes an 8.6% penetration rate for non-paying app users and 2.5% for paying app users.
Average Revenue Per User (ARPU) From Apps in India
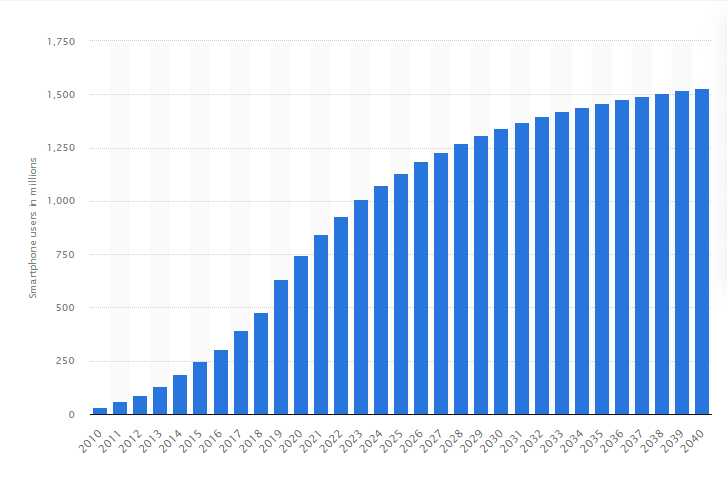
According to the business standard, Indians downloaded more than 853 million apps in 2022 and spent over four hours a day on their smartphones on average. The Statista report further reveals that app downloads almost tripled between 2019 and 2023. The report predicts the number of app downloads in India to increase in the coming years as the smartphone user base increases from 748.32 million in 2020 to over 931 million in 2022 which is about to cross 1530.76 million by 2040.
(The graph above shows the smartphone users growth in India during the forecast period 2010-2040 [Image Source: Statista])
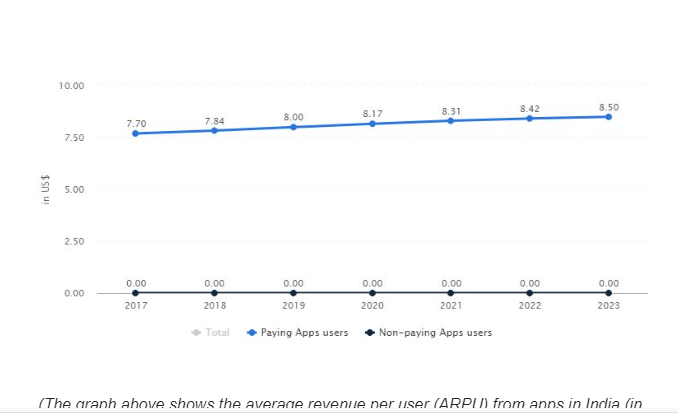
Perhaps, this is the reason Statista predicts the average revenue per user from apps in India to increase each year over the next four years. In 2019, the average revenue per user (ARPU) from apps in India was recorded at $8.00 per user. By the end of 2023, this grew to $8.50. While this growth may seem very small in number, it greatly increases the overall revenue collection from apps in India. Following is a graph showing the forecasted average revenue per user (ARPU) from apps in India during 2017-2023:
(The graph above shows the average revenue per user (ARPU) from apps in India (in US$) during the forecast period 2017-2023 [Image Source: Statista])
From the above graph, we find that the average revenue per user (ARPU) from apps in India in 2017 was $7.70. Of course, this ARPU relates only to paying app users, and non-paying app users have no contribution to it.
In 2018, the average revenue per user (ARPU) from apps in India increased to $7.84, and in 2019, it was recorded at $8.00 per user. In 2020, the average revenue per user (ARPU) from apps in India grew to $8.17. In the year 2021, it reached $8.31, and $ 8.42 in the year 2022. Finally, in the last year of the forecast period, which is 2023, the average revenue per user (ARPU) from apps in India is expected to grow to $8.50, an increase of $0.80 from 2017, the first year of the forecast period.
So, by now, we have taken a look at the total number of app users in India, the user penetration rate in the apps segment in the country, and the average revenue per user (ARPU) from apps in India during 2017-2023.
Now, we are going to discuss the app user base in India for different parameters. These parameters include downloads by segment, daily app usage by segment, gender, and revenue comparison. We will start with app downloads by segment.
App Downloads By Segments in India
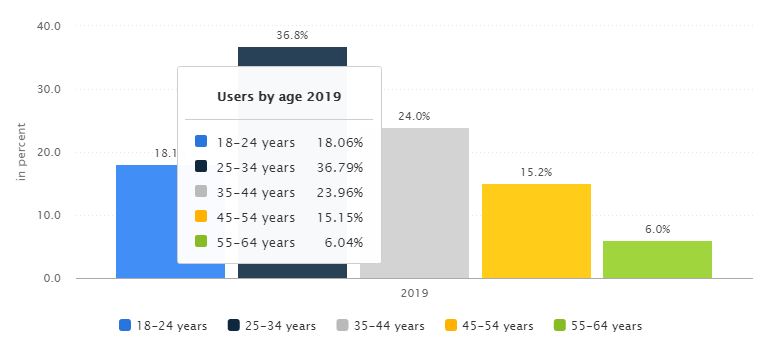
Till 2019, of the overall app users in India, more than 31% were between the ages of 18 and 34. Following is a graph illustrating this:
(The bar chart above shows the percentage of app users in India by age in 2019-2025 [Image Source: Statista])
From the above bar chart, we find that, till 2019, the majority of app users in India 34% of them were between the ages of 12 and 17. The age group that had the second greatest number of app users in India was 18-34, making up 31% of the overall app users in India till 2019.
In third place was the 35-54 age group, with a 29% share of the overall app user base in India. Not to anyone’s surprise, the age group with the least number of app users in India was the 55 and older age group, making up just 7% of the overall app users in India till 2019.
When it comes to 2019 to 2025, the age group 12-17 is going to hold 19% whereas the age group 18-34 is predicted to reach 14%. The age group 35-54 years has the highest number of app users with almost 40% whereas the 55 and older age group holds 26% of the share.
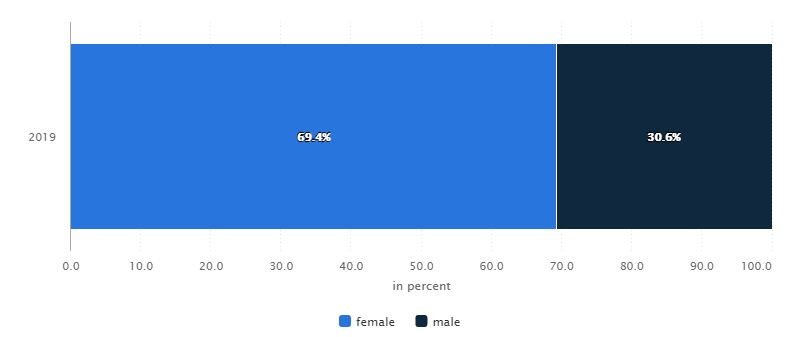
App Users in India by Gender
(The infographic above shows the percentage of app users by gender in India in 2019 [Image Source: Statista])
It comes as a surprise that the number of female app users in India far exceeds the number of male app users in the country. From the above infographic, we find that, compared to 30.6% of male app users in India in 2019, female app users made up almost 70% of the overall app users in India. That is more than two times more than the male app user population in the country.
App Users in India by Income
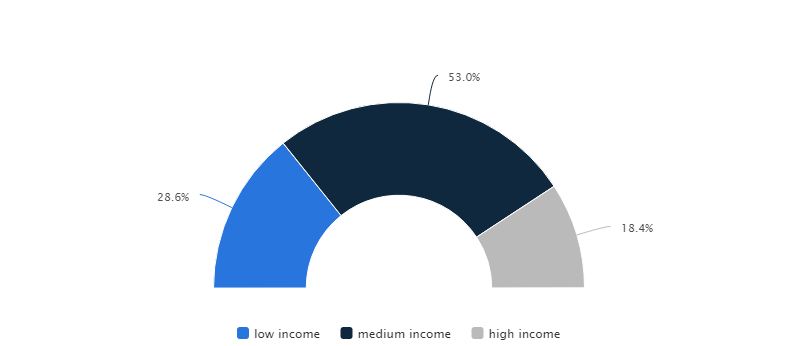
(The infographic above shows app users in India by income in 2019 [Image Source: Statista])
The infographic above shows the percentage of app users in India by income. The app users in India have been categorized into three different income groups: low-income medium income, and high-income. The greatest number of app users in India falls in the medium-income category, with a 53% share of the overall app users in the country.
The income category with the second greatest number of app users in India is the low-income category, with 28.6% of the total app users. The high-income group comes in last place, with only 18.4% of the total app users in India being a part of this group.
App Revenue in India Compared to the Rest of the World
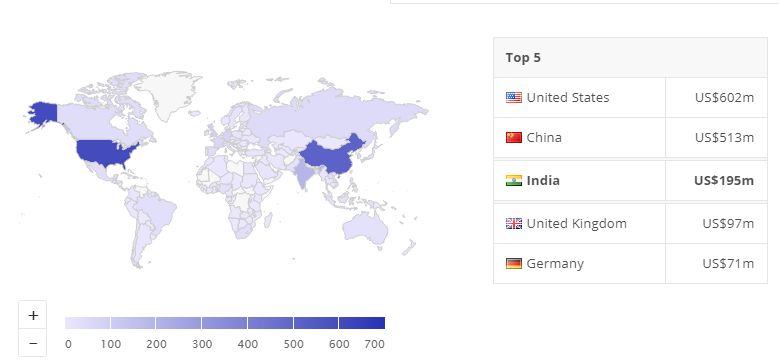
The country that generated the most revenue from apps in 2023 was China. The total revenue collected from apps in China. in 2019 was $602 million. In comparison, the total revenue generated from apps in India in 2023 was $3.05 billion. Following is an illustration of this:
(The infographic above shows the 5 countries with the greatest revenue collection from apps in 2019 [Image Source: Statista])
From the above infographic, we find that the country with the greatest revenue collection from apps in 2023 was China. The total revenue collected from apps in China in 2023 was $182.70 billion. The United States came in second place with $153 billion in revenue collection from apps. Whereas Japan came in third place with $31.77 billion the United Kingdom came in fourth place with $16.75 billion and South Korea ranked fifth with $10.99 billion.
The Cost of App Development in India and Why Outsource to India
If you’re considering developing an app for your business, then you must consider the top app development companies in India for app development, at the very least. This is because the app development companies in India are experts at app development, whether it is iPhone app development or Android app development. More importantly, it will cost you far less to get your app developed in India than in other parts of the world where app development service is offered.
For example, it will cost you less than $25000 in India to build a simple app while the cost for the same in the U.S. will be over $80000 in the year 2025. Additionally, a complex app in India can be built by a mobile app development company for less than $100,000, while an app development company in the U.S. will require you to pay an amount in excess of $300,000 for the same.
In the year 2025, the
cost of app development in India is probably lowest amongst all the countries where quality app development is performed. The skills below are typically required in app development:
-
Developer
-
Team lead
-
Designer
-
Project manager
-
Tester
-
Back end development (in some app development projects)
The cost of app development in India will depend on the hourly rate of these roles in the country. The average hourly rates in the year 2025 for these roles are as follows:
|
Role
|
Average Hourly Rate
|
|
Project Manager
|
$28
|
|
Developer
|
$23
|
|
Designer
|
$20
|
|
Tester
|
$20
|
|
Back End Developer
|
$20
|
Based on the above hourly rates and the average time needed to develop an app, we are able to determine the average cost of app development in India. However, we also find that the cost of app development in India changes with category and platform. For instance, the cost of app development of a mCommerce app such as a grocery purchasing app can be anything between $9990 for native apps for either Android or iOS. Developing a native grocery purchasing app that works on both Android and iOS will cost you $25,000, while hybrid grocery apps for both platforms will cost you $22,000 in the year 2025.
On the other hand, developing a cab-ride booking app or social networking app will cost you a lot more, as is depicted in the table above. In addition to this, there are some factors that can affect the cost of app development in India in 2025.
For instance, your cost of app development will depend on your app concept and requirements. It will also depend on the complexity of the app’s user interface (UI) design. Additionally, the cost of app development in India may increase with the integration of payment services, GPS, and localization, and the need for maintaining, troubleshooting, and supporting the app server. Despite this, India is the most affordable destination for mobile app development.
If you still need convincing to outsource mobile app development to India, then there are several reasons for you to outsource to the country in the year 2025. These include (but are not limited to) the following:
-
The lowest cost of quality mobile app development
-
Quicker turnaround or a short development time
-
Experience developers
-
State-of-the-art app development technology/tools
-
Multi-platform capability
Quality mobile app development offered at a low price is one of the primary reasons India is considered to be the best destination for app development. Additionally, the top app development companies in India have the necessary skills and experience required to meet the app development requirements of a global clientele with varying needs.
Another specialty of app development companies in India is the ability to provide customers with real-time updates about app development and ensure the prompt delivery of the app. App developers in India also ensure a seamless or the best possible user experience. They do this by leveraging innovative processes and state-of-the-art technology.
Finally, app developers in India have the skills and experience to develop apps that are compatible with multiple platforms such as Android, iOS, and Windows.
Conclusion
From the above, we find that the Indian App Development industry has evolved and grown tremendously over the years. In fact, in the year 2025, India is now the fastest-growing market for apps in the world. Not only are the number of app downloads and users in India increasing each year, but we are also witnessing an increase in the overall revenue generated from apps in the country.
In addition to the above, India has become the preferred destination for app development for businesses around the world. How the App Development industry is growing in India is discussed in great detail in this guide. We have also discussed in this guide the most popular free and paid app categories in the country, mobile app usage and revenue in India, the cost of app development in India for 2025, and the top reasons to outsource app development to the country.
Our Review Process
Our writers spent more than 20 hours researching the Indian App Development industry, including its growth over the years. To come up with the information and statistics presented above, they read through the research of top sites. This research process makes the information provided by us trustworthy.